Tuning hyper-parameters with CodeFlare Pipelines
GridSearchCV() is often used for hyper-parameter turning for a model constructed via sklearn pipelines. It does an exhaustive search over specified parameter values for a pipeline. It implements a fit() method and a score() method. The parameters of the pipeline used to apply these methods are optimized by cross-validated grid-search over a parameter grid.
Here we show how to convert an example of using GridSearchCV() to tune the hyper-parameters of an sklearn pipeline into one that uses Codeflare (CF) pipelines grid_search_cv(). We use the Pipelining: chaining a PCA and a logistic regression from sklearn pipelines as an example.
In this sklearn example, a pipeline is chained together with a PCA and a LogisticRegression. The n_components parameter of the PCA and the C parameter of the LogisticRegression are defined in a param_grid: with n_components in [5, 15, 30, 45, 64] and C defined by np.logspace(-4, 4, 4). A total of 20 combinations of n_components and C parameter values will be explored by GridSearchCV() to find the best one with the highest mean_test_score.
pca = PCA()
logistic = LogisticRegression(max_iter=10000, tol=0.1)
pipe = Pipeline(steps=[('pca', pca), ('logistic', logistic)])

X_digits, y_digits = datasets.load_digits(return_X_y=True)

param_grid = {
    'pca__n_components': [5, 15, 30, 45, 64],
    'logistic__C': np.logspace(-4, 4, 4),
}
search = GridSearchCV(pipe, param_grid, n_jobs=-1)
search.fit(X_digits, y_digits)
print("Best parameter (CV score=%0.3f):" % search.best_score_)
print(search.best_params_)
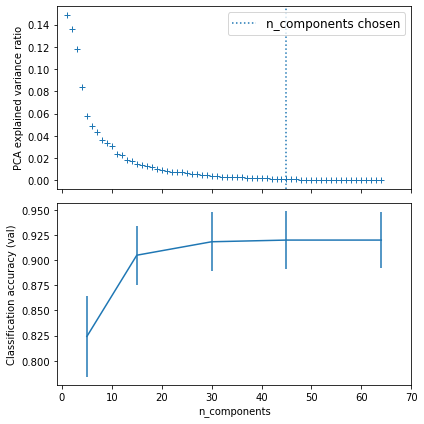
After running GridSearchCV().fit(), the best parameters of PCA__n_components and LogisticRegression__C, together with the cross-validated mean_test scores are printed out as follows. In this example, the best n_components chosen is 45 for the PCA.
Best parameter (CV score=0.920):
{'logistic__C': 0.046415888336127774, 'pca__n_components': 45}
The PCA explained variance ratio and the best n_components chosen are plotted in the top chart. The classification accuracy and its std_test_score are plotted in the bottom chart. The best n_components can be obtained by calling best_estimator_.named_step['pca'].n_components from the returned object of GridSearchCV().
Converting to CodeFalre Pipelines with grid search
We next describe the step-by-step conversion of this example to one that uses CodeFlare Pipelines.
Step 1: importing codeflare.pipelines packages and ray
We need to first import various codeflare.pipelines packages, including Datamodel and runtime, as well as ray and call ray.shutdwon() and ray.init(). Note that, in order to run this CodeFlare example notebook, you need to have a running ray instance.
import codeflare.pipelines.Datamodel as dm
import codeflare.pipelines.Runtime as rt
from codeflare.pipelines.Datamodel import Xy
from codeflare.pipelines.Datamodel import XYRef
from codeflare.pipelines.Runtime import ExecutionType
import ray
ray.shutdown()
ray.init()
Step 2: defining and setting up a codeflare pipeline
A codeflare pipeline is defined by EstimatorNodes and edges connecting two EstimatorNodes. In this case, we define node_pca and node_logistic and we connect these two nodes with pipeline.add_edge(). Before we can execute fit() on a pipeline, we need to set up the proper input to the pipeline.
pca = PCA()
# set the tolerance to a large value to make the example faster
logistic = LogisticRegression(max_iter=10000, tol=0.1)
pipeline = dm.Pipeline()
node_pca = dm.EstimatorNode('pca', pca)
node_logistic = dm.EstimatorNode('logistic', logistic)
pipeline.add_edge(node_pca, node_logistic)
# input to pipeline
pipeline_input = dm.PipelineInput()
pipeline_input.add_xy_arg(node_pca, dm.Xy(X_digits, y_digits))
Step 3: defining pipeline param grid and executing Codeflare pipelines grid_search_cv()
Codeflare pipelines runtime converts an sklearn param_grid into a codeflare pipelines param grid. We also specify the default KFold parameter for running the cross-validation. Finally, Codeflare pipelines runtime executes the grid_search_cv().
# param_grid
param_grid = {
        'pca__n_components': [5, 15, 30, 45, 64],
        'logistic__C': np.logspace(-4, 4, 4),
    }

pipeline_param = dm.PipelineParam.from_param_grid(param_grid)

# default KFold for grid search
k = 5
kf = KFold(k)

# execute CF pipeplie grid_search_cv
result = rt.grid_search_cv(kf, pipeline, pipeline_input, pipeline_param)
Step 4: parsing the returned result from grid_search_cv()
As the Codeflare pipelines project is still actively under development, APIs to access some attributes of the explored pipelines in the grid_search_cv() are not yet available. As a result, a slightly more verbose code is used to get the best pipeline, its associated parameter values and other statistics from the returned object of grid_search_cv(). For example, we need to loop through all the 20 explored pipelines to get the best pipeline. And, to get the n_component of an explored pipeline, we first use .get_nodes() on the returned cross-validated pipeline and then use .get_estimator() and then finally use .get_params().
import statistics

# pick the best mean' and best pipeline
best_pipeline = None
best_mean_scores = 0.0
best_n_components = 0

df = pd.DataFrame(columns =('n_components', 'mean_test_score', 'std_test_score'))

for cv_pipeline, scores in result.items():
    mean = statistics.mean(scores)
    std = statistics.stdev(scores)
    n_components = 0
    params = {}
    # get the 'n_components' value of the PCA in this cv_pipeline
    for node_name, node in cv_pipeline.get_nodes().items():
        params[node_name] = node.get_estimator().get_params()
        if 'n_components' in params[node_name]:
            n_components = params[node_name]['n_components']
    assert(n_components > 0)
    df = df.append({'n_components' : n_components, 'mean_test_score' : mean, 'std_test_score' : std}, ignore_index=True)
    if mean > 0.92:
        print(mean)
        print(str(params))

    if mean > best_mean_scores:
        best_pipeline = cv_pipeline
        best_mean_scores = mean
        best_n_components = n_components
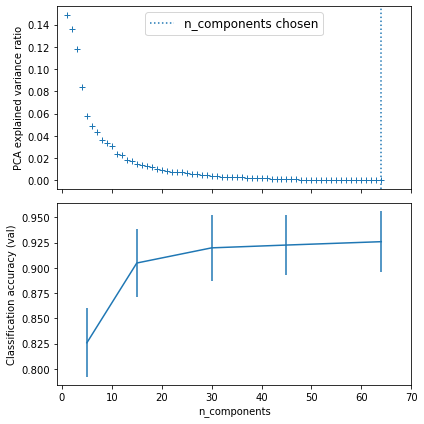
Due to the differences in split, the CodeFlare pipelines grid_search_cv() produces the best pipeline with n_components = 64 for the PAC, and the 2nd best with n_components = 45. We print out the parameters of the 2nd best and the best pipelines as follows.
0.9226679046734757
{'pca__3': {'copy': True, 'iterated_power': 'auto', 'n_components': 45, 'random_state': None, 'svd_solver': 'auto', 'tol': 0.0, 'whiten': False}, 'logistic__1': {'C': 0.046415888336127774, 'class_weight': None, 'dual': False, 'fit_intercept': True, 'intercept_scaling': 1, 'l1_ratio': None, 'max_iter': 10000, 'multi_class': 'auto', 'n_jobs': None, 'penalty': 'l2', 'random_state': None, 'solver': 'lbfgs', 'tol': 0.1, 'verbose': 0, 'warm_start': False}}
0.9260058805323429
{'pca__4': {'copy': True, 'iterated_power': 'auto', 'n_components': 64, 'random_state': None, 'svd_solver': 'auto', 'tol': 0.0, 'whiten': False}, 'logistic__1': {'C': 0.046415888336127774, 'class_weight': None, 'dual': False, 'fit_intercept': True, 'intercept_scaling': 1, 'l1_ratio': None, 'max_iter': 10000, 'multi_class': 'auto', 'n_jobs': None, 'penalty': 'l2', 'random_state': None, 'solver': 'lbfgs', 'tol': 0.1, 'verbose': 0, 'warm_start': False}}
The corresponding plots are similar to those from the sklearn GridSearchCV(), except that the n_components chosen is 64 for the best score for the CodeFlare pipelines grid_search_cv().
The Jupyter notebook of this example is available here. Please download it and try it out to understand how you might convert an sklearn example to one that uses Codeflare pipelines. And please let us know what you think.